SKEDSOFT
Block diagrams:
A block diagram of a system is a pictorial representation of the functions performed by each component and of the flow of signals. Such a diagram depicts the interrelationships that exist among the various components. Differing from a purely abstract mathematical representation, a block diagram has the advantage of indicating more realistically the signal flows of the actual system.
In a block diagram all system variables are linked to each other through functional blocks. The functional block or simply block is a symbol for the mathematical operation on the input signal to the block that produces the output. The transfer functions of the components are usually entered in the corresponding blocks, which are connected by arrows to indicate the direction of the flow of signals. Note that the signal can pass only in the direction of the arrows. Thus a block diagram of a control system explicitly shows a unilateral property.
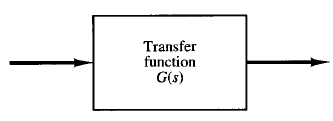
Fig: 1 Element of a block diagram.
Figure 1 shows an element of the block diagram. The arrowhead pointing toward the block indicates the input, and the arrowhead leading away from the block represents the output. Such arrows are referred to as signals. Note that the dimensions of the output signal from the block are the dimensions of the input signal multiplied by the dimensions of the transfer function in the block.
The advantages of the block diagram representation of a system lie in the fact that it is easy to form the overall block diagram for the entire system by merely connecting the blocks of the components according to the signal flow and that it is possible to evaluate the contribution of each component to the overall performance of the system.
In general, the functional operation of the system can be visualized more readily by examining the block diagram than by examining the physical system itself. A block diagram contains information concerning dynamic behavior, but it does not include any information on the physical construction of the system.
Consequently, many dissimilar and unrelated systems can be represented by the same block diagram. It should be noted that in a block diagram the main source of energy is not explicitly shown and that the block diagram of a given system is not unique. A number of different block diagrams can be drawn for a system, depending on the point of view of the analysis.
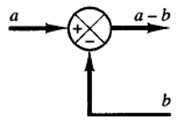
Fig: 2 Summing point
Summing Point:
Referring to Figure 2, a circle with a cross is the symbol that indicates a summing operation. The plus or minus sign at each arrowhead indicates whether that signal is to be added or subtracted. It is important that the quantities being added or subtracted have the same dimensions and the same units.
Branch Point:
A branch point is a point from which the signal from a block goes concurrently to other blocks or summing points.
