SKEDSOFT
Bode diagrams or logarithmic plots
A sinusoidal transfer function may be represented by two separate plots, one giving the magnitude versus frequency and the other the phase angle (in degrees) versus frequency. A Bode diagram consists of two graphs: One is a plot of the logarithm of the magnitude of a sinusoidal transfer function; the other is a plot of the phase angle; both are plotted against the frequency in logarithmic scale.
The standard representation of the logarithmic magnitude of G(jω) is 20log |G(jω)|, where the base of the logarithm is 10. The unit used in this representation of the magnitude is the decibel, usually abbreviated dB. In the logarithmic representation, the curves are drawn on semilog paper, using the log scale for frequency and the linear scale for either magnitude (but in decibels) or phase angle (in degrees). (The frequency range of interest determines the number of logarithmic cycles required on the abscissa.)
The main advantage of using the Bode diagram is that multiplication of magnitudes can be converted into addition. Furthermore, a simple method for sketching an approximate log-magnitude curve is available. It is based on asymptotic approximations. Such approximation by straight-line asymptotes is sufficient if only rough information on the frequency-response characteristics is needed.
Should exact curve be desired, corrections can be made easily to these basic asymptotic ones. The phase-angle curves can be drawn easily if a template for the phase-angle curve of 1 jω is available. Expanding the low-frequency range by use of a logarithmic scale for the frequency is very advantageous since characteristics at low frequencies are most important in practical systems.
Although it is not possible to plot the curves right down to zero frequency because of the logarithmic frequency (log 0 = -∞), this does not create a serious problem. Note that the experimental determination of a transfer function can be made simple if frequency-response data are presented in the form of a Bode diagram.
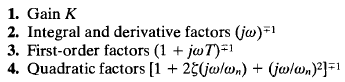
Basic factors of G(jω)H(jω):
The main advantage in using the logarithmic plot is the relative ease of plotting frequency-response curves. The basic factors that very frequently occur in an arbitrary transfer function G(jω)H(jω) are
It is possible to utilize the logarithmic plots of these basic factors in constructing a composite logarithmic plot for any general form of G(jω)H(jω) by sketching the curves for each factor and adding individual curves graphically, because adding the logarithms of the gains corresponds to multiplying them together.
The process of obtaining the logarithmic plot can be further simplified by using asymptotic approximations to the curves for each factor. (If necessary, corrections can be made easily to an approximate plot to obtain an accurate one.)
