SKEDSOFT
Closed-loop frequency response of unity-feedback systems
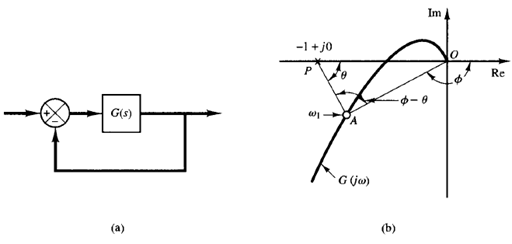
Fig: 1 (a) Unity-feedback system; (b) determination of closed-loop frequency response from open-loop frequency response
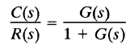
For a stable closed-loop system, the frequency response can be obtained easily from that of the open loop. Consider the unity-feedback system shown in Figure 1(a). The closed-loop transfer function is
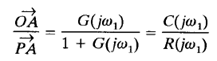
In the Nyquist or polar plot shown in Figure 1(b), the vector  represents G(jω1), where ω1 is the frequency at point A. The length of the vector is |G(jω1)| and the angle of the vector is
  . The vector
  , the vector from the -1 j0 point to the Nyquist locus, represents 1 G(jω1). Therefore, the ratio of to represents the closed-loop frequency response, or
The magnitude of the closed-loop transfer function at ω = ω1 is the ratio of the magnitudes of to . The phase angle of the closed-loop transfer function at ω = ω1 is the angle formed by the vectors to , that is Φ - θ, shown in Figure 1(b). By measuring the magnitude and phase angle at different frequency points, the closed-loop frequency-response curve can be obtained.
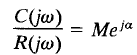
Let us define the magnitude of the closed-loop frequency response as M and the phase angle as a, or
The constant magnitude loci and constant phase-angle loci are convenient in determining the closed-loop frequency response from the polar plot or Nyquist plot.
