SKEDSOFT
Nichols chart
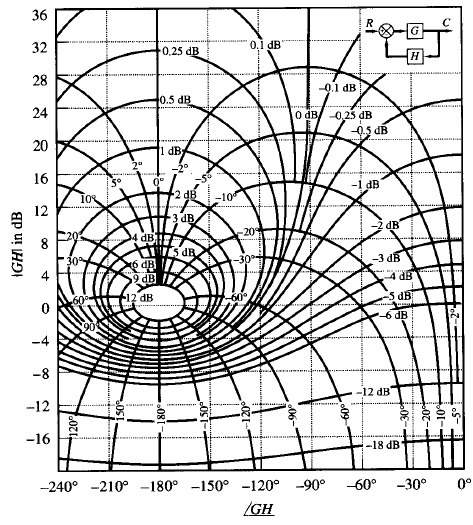
Fig: 1 Nichols chart
In dealing with design problems, we find it convenient to construct the M and N loci in the log-magnitude versus phase plane. The chart consisting of the M and N loci in the log-magnitude versus phase diagram is called the Nichols chart. This chart is shown in Figure 1, for phase angles between 0° and -240°. Note that the critical point (-1 j0 point) is mapped to the Nichols chart as the point (0 dB, -180°).
The Nichols chart contains curves of constant closed-loop magnitude and phase angle. The designer can graphically determine the phase margin, gain margin, resonant peak magnitude, resonant peak frequency, and bandwidth of the closed-loop system from the plot of the open-loop locus, G(jω).
The Nichols chart is symmetric about the -180° axis. The M and N loci repeat for every 360°, and there is symmetry at every 180° interval. The M loci are centered about the critical point (0 dB, -180°). The Nichols chart is useful for determining the frequency response of the closed loop from that of the open loop.
If the open-loop frequency response curve is superimposed on the Nichols chart, the intersections of the open-loop frequency-response curve G(jω) and the M and N loci give the values of the magnitude M and phase angle a of the closed-loop frequency response at each frequency point.
If the G(jω) locus does not intersect the M = Mr locus but is tangent to it, then the resonant peak value of M of the closed-loop frequency response is given by Mr. The resonant peak frequency is given by the frequency at the point of tangency.
