SKEDSOFT
Introduction: Chameleon is a hierarchical clustering algorithm that uses dynamic modeling to determine the similarity between pairs of clusters. It was derived based on the observed weaknesses of two hierarchical clustering algorithms: ROCK and CURE. ROCK and related schemes emphasize cluster interconnectivity while ignoring information regarding cluster proximity. CURE and related schemes consider cluster proximity yet ignore cluster interconnectivity.
In Chameleon, cluster similarity is assessed based on how well-connected objects are within a cluster and on the proximity of clusters. That is, two clusters are merged if their interconnectivity is high and they are close together. Thus, Chameleon does not depend on a static, user-supplied model and can automatically adapt to the internal characteristics of the clusters being merged. The merge process facilitates the discovery of natural and homogeneous clusters and applies to all types of data as long as a similarity function can be specified.
“How does Chameleon work?” The main approach of Chameleon is illustrated in Figure 7.9. Chameleon uses a k-nearest-neighbor graph approach to construct a sparse graph, where each vertex of the graph represents a data object, and there exists an edge between two vertices (objects) if one object is among the k-most-similar objects of the other. The edges are weighted to reflect the similarity between objects. Chameleon uses a graph partitioning algorithm to partition the k-nearest-neighbor graph into a large number of relatively small sub clusters. It then uses an agglomerative hierarchical clustering algorithm that repeatedly merges sub clusters based on their similarity. To determine the pairs of most similar sub clusters, it takes into account both the interconnectivity as well as the closeness of the clusters. We will give a mathematical definition for these criteria shortly.
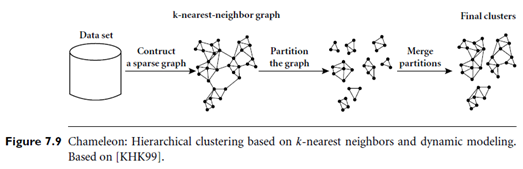
Note that the k-nearest-neighbor graph captures the concept of neighborhood dynamically: the neighborhood radius of an object is determined by the density of the region in which the object resides. In a dense region, the neighborhood is defined narrowly; in a sparse region, it is defined more widely. This tends to result in more natural clusters, in comparison with density-based methods like DBSCAN (described in Section 7.6.1) that instead use a global neighborhood. Moreover, the density of the region is recorded as the weight of the edges. That is, the edges of a dense region tend to weigh more than that of a sparse region.
The graph-partitioning algorithm partitions the k-nearest-neighbor graph such that it minimizes the edge cut. That is, a cluster C is partitioned into sub clusters Ci and Cj so as to minimize the weight of the edges that would be cut should C be bisected into Ci and Cj. Edge cut is denoted EC{Ci, Cj} and assesses the absolute interconnectivity between clusters Ci and Cj.
Chameleon determines the similarity between each pair of clusters Ci and Cj according to their relative interconnectivity, RI (Ci, Cj), and their relative closeness, RC(Ci, Cj):
The relative interconnectivity, RI(Ci, Cj), between two clusters, Ci and Cj, is defined as the absolute interconnectivity between Ci and Cj, normalized with respect to the internal interconnectivity of the two clusters, Ci and Cj. That is,
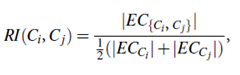
where EC{Ci, Cj} is the edge cut, defined as above, for a cluster containing both Ci and Cj. Similarly, ECCi (or ECCj ) is the minimum sum of the cut edges that partition Ci (or Cj) into two roughly equal parts.
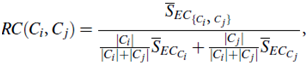
The relative closeness, RC(Ci, Cj), between a pair of clusters, Ci and Cj, is the absolute closeness between Ci and Cj, normalized with respect to the internal closeness of the two clusters, Ci and Cj. It is defined as where SEC{Ci;Cj} is the average weight of the edges that connect vertices in Ci to vertices in Cj, and SECCi (or SECCj ) is the average weight of the edges that belong to the min-cut bisector of cluster Ci (or Cj).
Chameleon has been shown to have greater power at discovering arbitrarily shaped clusters of high quality than several well-known algorithms such as BIRCH and density based DBSCAN. However, the processing cost for high-dimensional data may require O(n2) time for n objects in the worst case.
