SKEDSOFT
Clustering: Clustering techniques consider data tuples as objects. They partition the objects into groups or clusters, so that objects within a cluster are “similar” to one another and “dissimilar” to objects in other clusters. Similarity is commonly defined in terms of how “close” the objects are in space, based on a distance function. The “quality” of a cluster may be represented by its diameter, the maximum distance between any two objects in the cluster. Centroid distance is an alternative measure of cluster quality and is defined as the average distance of each cluster object from the cluster centroid (denoting the “average object,” or average point in space for the cluster). Figure 2.12 of Section 2.3.2 shows a 2-D plot of customer data with respect to customer locations in a city, where the centroid of each cluster is shown with a “ ”. Three data clusters are visible.
 In data reduction, the cluster representations of the data are used to replace the actual data. The effectiveness of this technique depends on the nature of the data. It is much more effective for data that can be organized into distinct clusters than for smeared data.
In database systems, multidimensional index trees are primarily used for providing fast data access. They can also be used for hierarchical data reduction, providing a multi solution clustering of the data. This can be used to provide approximate answers to queries. An index tree recursively partitions the multidimensional space for a given set of data objects, with the root node representing the entire space. Such trees are typically balanced, consisting of internal and leaf nodes. Each parent node contains keys and pointers to child nodes that, collectively, represent the space represented by the parent node. Each leaf node contains pointers to the data tuples they represent (or to the actual tuples).
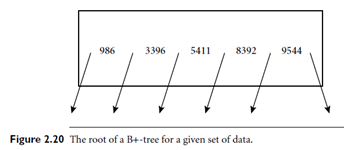
An index tree can therefore store aggregate and detail data at varying levels of resolution or abstraction. It provides a hierarchy of clusterings of the data set, where each cluster has a label that holds for the data contained in the cluster. If we consider each child of a parent node as a bucket, then an index tree can be considered as a hierarchical histogram. For example, consider the root of a B -tree as shown in Figure 2.20, with pointers to the data keys 986, 3396, 5411, 8392, and 9544. Suppose that the tree contains 10,000 tuples with keys ranging from 1 to 9999. The data in the tree can be approximated by an equal-frequency histogram of six buckets for the key ranges 1 to 985, 986 to 3395, 3396 to 5410, 5411 to 8391, 8392 to 9543, and 9544 to 9999. Each bucket contains roughly 10,000/6 items. Similarly, each bucket is subdivided into smaller buckets, allowing for aggregate data at a finer-detailed level. The use of multidimensional index trees as a form of data reduction relies on an ordering of the attribute values in each dimension. Two-dimensional or multidimensional index trees include R-trees, quad-trees, and their variations. They are well suited for handling both sparse and skewed data.
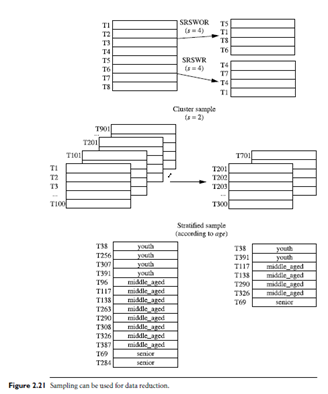
 Sampling: Sampling can be used as a data reduction technique because it allows a large data set to be represented by a much smaller random sample (or subset) of the data. Suppose that a large data set, D, contains N tuples. Let’s look at the most common ways that we could sample D for data reduction, as illustrated in Figure 2.21.
Simple random sample without replacement (SRSWOR) of size s: This is created by drawing s of the N tuples fromD (s < N), where the probability of drawing any tuple in D is 1=N, that is, all tuples are equally likely to be sampled. Simple random sample with replacement (SRSWR) of size s: This is similar to SRSWOR, except that each time a tuple is drawn from D, it is recorded and then replaced. That is, after a tuple is drawn, it is placed back in D so that it may be drawn again.
Cluster sample: If the tuples in D are grouped into M mutually disjoint “clusters,” then an SRS of s clusters can be obtained, where s < M. For example, tuples in a database are usually retrieved a page at a time, so that each page can be considered a cluster. A reduced data representation can be obtained by applying, say, SRSWOR to the pages, resulting in a cluster sample of the tuples. Other clustering criteria conveying rich semantics can also be explored. For example, in a spatial database, we may choose to define clusters geographically based on how closely different areas are located.
Stratified sample: If D is divided into mutually disjoint parts called strata, a stratified sample of D is generated by obtaining an SRS at each stratum. This helps ensure a representative sample, especially when the data are skewed. For example, a stratified sample may be obtained from customer data, where a stratum is created for each customer age group. In this way, the age group having the smallest number of customers will be sure to be represented.
An advantage of sampling for data reduction is that the cost of obtaining a sample is proportional to the size of the sample, s, as opposed to N, the data set size. Hence, sampling complexity is potentially sub linear to the size of the data.