SKEDSOFT
For skewed (asymmetric) data, a better measure of the center of data is the median. Suppose that a given data set of N distinct values is sorted in numerical order. If N is odd, then the median is the middle value of the ordered set; otherwise (i.e., if N is even), the median is the average of the middle two values.
A holistic measure is a measure that must be computed on the entire data set as a whole. It cannot be computed by partitioning the given data into subsets and merging the values obtained for the measure in each subset. The median is an example of a holistic measure. Holistic measures are much more expensive to compute than distributive measures such as those listed above.
We can, however, easily approximate the median value of a data set. Assume that data are grouped in intervals according to their xi data values and that the frequency (i.e., number of data values) of each interval is known. For example, people may be grouped according to their annual salary in intervals such as 10–20K, 20–30K, and so on. Let the interval that contains the median frequency be the median interval. We can approximate the median of the entire data set (e.g., the median salary) by interpolation using the formula:
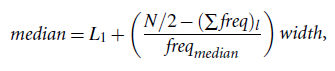
where L1 is the lower boundary of the median interval, N is the number of values in the entire data set,(å f req)l is the sum of the frequencies of all of the intervals that are lower than the median interval, f reqmedianis the frequency of the median interval, and width is the width of the median interval.
Another measure of central tendency is the mode. The mode for a set of data is the value that occurs most frequently in the set. It is possible for the greatest frequency to correspond to several different values, which results in more than one mode. Data sets with one, two, or three models are respectively called unimodal, bimodal, and tri modal. In general, a data set with two or more modes is multimodal. At the other extreme, if each data value occurs only once, then there is no mode. For unimodal frequency curves that are moderately skewed (asymmetrical), we have the following empirical relation:
Mean-mode = 3 X (mean-median).
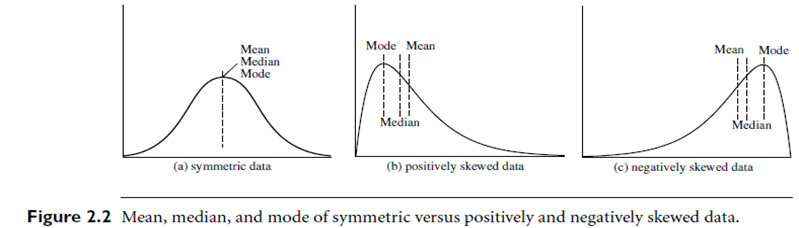
This implies that the mode for unimodal frequency curves that are moderately skewed can easily be computed if the mean and median values are known. In a unimodal frequency curve with perfect symmetric data distribution, the mean, median, and mode are all at the same center value, as shown in Figure 2.2(a). However, data in most real applications are not symmetric. They may instead be either positively skewed, where the mode occurs at a value that is smaller than the median (Figure 2.2(b)), or negatively skewed, where the mode occurs at a value greater than the median (Figure 2.2(c)).
The midrange can also be used to assess the central tendency of a data set. It is the average of the largest and smallest values in the set. This algebraic measure is easy to compute using the SQL aggregate functions, max() and min().
