SKEDSOFT
Principal Components Analysis: In this subsection we provide an intuitive introduction to principal components analysis as a method of dimensionality reduction. A detailed theoretical explanation is beyond the scope of this book.
Suppose that the data to be reduced consist of tuples or data vectors described by n attributes or dimensions. Principal components analysis, or PCA (also called the Karhunen-Loeve, or K-L, method), searches for k n-dimensional orthogonal vectors that can best be used to represent the data, where k ≤ n. The original data are thus projected onto a much smaller space, resulting in dimensionality reduction. Unlike attribute subset selection, which reduces the attribute set size by retaining a subset of the initial set of attributes, PCA “combines” the essence of attributes by creating an alternative, smaller set of variables. The initial data can then be projected onto this smaller set. PCA often reveals relationships that were not previously suspected and thereby allows interpretations that would not ordinarily result.
The basic procedure is as follows:
1. The input data are normalized, so that each attribute falls within the same range. This step helps ensure that attributes with large domains will not dominate attributes with smaller domains.
2. PCA computes k orthonormal vectors that provide a basis for the normalized input data. These are unit vectors that each point in a direction perpendicular to the others. These vectors are referred to as the principal components. The input data are a linear combination of the principal components.
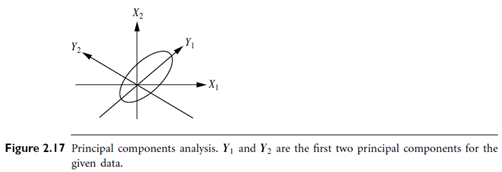
3. The principal components are sorted in order of decreasing “significance” or strength. The principal components essentially serve as a new set of axes for the data, providing important information about variance. That is, the sorted axes are such that the first axis shows the most variance among the data, the second axis shows the next highest variance, and so on. For example, Figure 2.17 shows the first two principal components, Y1 and Y2, for the given set of data originally mapped to the axes X1 and X2. This information helps identify groups or patterns within the data.
4. Because the components are sorted according to decreasing order of “significance,” the size of the data can be reduced by eliminating the weaker components, that is, those with low variance. Using the strongest principal components, it should be possible to reconstruct a good approximation of the original data.
PCA is computationally inexpensive, can be applied to ordered and unordered attributes, and can handle sparse data and skewed data. Multidimensional data of more than two dimensions can be handled by reducing the problem to two dimensions. Principal components may be used as inputs to multiple regression and cluster analysis. In comparison with wavelet transforms, PCA tends to be better at handling sparse data, whereas wavelet transforms are more suitable for data of high dimensionality.
