SKEDSOFT
Introduction: A time-series database consists of sequences of values or events obtained over repeated measurements of time. The values are typically measured at equal time intervals (e.g., hourly, daily, weekly). Time-series databases are popular in many applications, such as stock market analysis, economic and sales forecasting, budgetary analysis, utility studies, inventory studies, yield projections, workload projections, process and quality control, observation of natural phenomena (such as atmosphere, temperature, wind, earthquake), scientific and engineering experiments, and medical treatments.
A time-series database is also a sequence database. However, a sequence database is any database that consists of sequences of ordered events, with or without concrete notions of time. For example, Web page traversal sequences and customer shopping transaction sequences are sequence data, but they may not be time-series data. The mining of sequence data is discussed in Section 8.3. With the growing deployment of a large number of sensors, telemetry devices, and other on-line data collection tools, the amount of time-series data is increasing rapidly, often in the order of gigabytes per day (such as in stock trading) or even per minute (such as from NASA space programs). How can we find correlation relationships within time-series data? How can we analyze such huge numbers of time series to find similar or regular patterns, trends, bursts (such as sudden sharp changes), and outliers, with fast or even on-line real-time response. This has become an increasingly important and challenging problem. In this section, we examine several aspects of mining time-series databases, with a focus on trend analysis and similarity search.
Trend Analysis
A time series involving a variable Y, representing, say, the daily closing price of a share in a stock market, can be viewed as a function of time t, that is, Y = F(t). Such a function can be illustrated as a time-series graph, as shown in Figure 8.4, which describes a point moving with the passage of time.
In general, there are two goals in time-series analysis: (1) modeling time series (i.e., to gain insight into the mechanisms or underlying forces that generate the time series), and (2) forecasting time series (i.e., to predict the future values of the time-series variables).
Trend analysis consists of the following four major components or movements for characterizing time-series data:
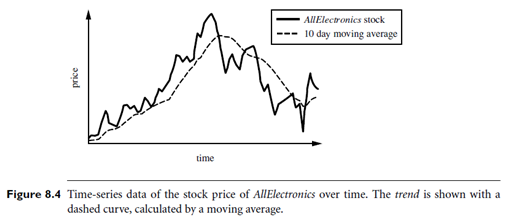
Trend or long-term movements: These indicate the general direction in which a time series graph is moving over a long interval of time. This movement is displayed by a trend curve, or a trend line. For example, the trend curve of Figure 8.4 is indicated by a dashed curve. Typical methods for determining a trend curve or trend line include the weighted moving average method and the least squares method, discussed later.
Cyclic movements or cyclic variations: These refer to the cycles, that is, the long-term oscillations about a trend line or curve, which may or may not be periodic. That is, the cycles need not necessarily follow exactly similar patterns after equal intervals of time.
Seasonal movements or seasonal variations: These are systematic or calendar related. Examples include events that recur annually, such as the sudden increase in sales of chocolates and flowers before Valentine’s Day or of department store items before Christmas. The observed increase in water consumption in summer due to warm weather is another example. In these examples, seasonal movements are the identical or nearly identical patterns that a time series appears to follow during corresponding months of successive years.
Irregular or random movements: These characterize the sporadic motion of time series due to random or chance events, such as labor disputes, floods, or announced personnel changes within companies.
Note that regression analysis has been a popular tool for modeling time series, finding trends and outliers in such data sets. Regression is a fundamental topic in statistics and is described in many textbooks. Thus, we will not spend much time on this theme. However, pure regression analysis cannot capture all of the four movements described above that occur in real-world applications. Hence, our discussion of trend analysis and modeling time series focuses on the above movements.
