SKEDSOFT
INFORMATION NETWORKS Graphs can be used to model various networks that link particular types of information. Here, we will describe how to model theWorldWideWeb using a graph. We will also describe how to use a graph to model the citations in different types of documents.
TheWeb Graph TheWorldWideWeb can be modeled as a directed graph where eachWeb page is represented by a vertex and where an edge starts at the Web page a and ends at the Web page b if there is a link on a pointing to b. Because newWeb pages are created and others removed somewhere on the Web almost every second, the Web graph changes on an almost continual basis. Many people are studying the properties of theWeb graph to better understand the nature of theWeb.We will return toWeb graphs in Section 10.4, and in Chapter 11 we will explain how theWeb graph is used by theWeb crawlers that search engines use to create indexes ofWeb pages.
EXAMPLE 6 Citation Graphs Graphs can be used to represent citations in different types of documents, including academic papers, patents, and legal opinions. In such graphs, each document is represented by a vertex, and there is an edge from one document to a second document if the
first document cites the second in its citation list. (In an academic paper, the citation list is the bibliography, or list of references; in a patent it is the list of previous patents that are cited; and in a legal opinion it is the list of previous opinions cited.) A citation graph is a directed graph without loops or multiple edges.
SOFTWARE DESIGN APPLICATIONS Graph models are useful tools in the design of software.We will briefly describe two of these models here.
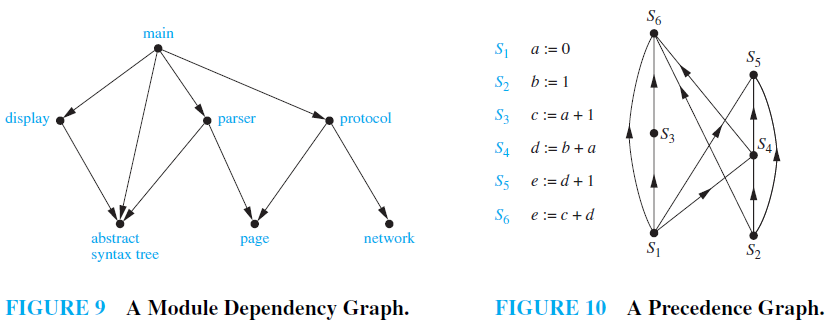
EXAMPLE 7 Module Dependency Graphs One of the most important tasks in designing software is howto structure a program into different parts, or modules. Understanding howthe different modules of a program interact is essential not only for program design, but also for testing and maintenance of the resulting software.Amodule dependency graph provides a useful tool for understanding how different modules of a program interact. In a program dependency graph, each module is represented by a vertex. There is a directed edge from a module to a second module if the second module depends on the first. An example of a program dependency graph for a web browser is shown in Figure 9.
EXAMPLE 8 Precedence Graphs and Concurrent Processing Computer programs can be executed more rapidly by executing certain statements concurrently. It is important not to execute a statement that requires results of statements not yet executed. The dependence of statements on previous statements can be represented by a directed graph. Each statement is represented by a vertex, and there is an edge from one statement to a second statement if the second statement cannot be executed before the first statement. This resulting graph is called a precedence graph. A computer program and its graph are displayed in Figure 10. For instance, the graph shows that statement S5 cannot be executed before statements S1, S2, and S4 are executed.
TRANSPORTATION NETWORKS We can use graphs to model many different types of transportation networks, including road, air, and rail networks, as well shipping networks.
EXAMPLE 9 Airline Routes We can model airline networks by representing each airport by a vertex. In particular, we can model all the flights by a particular airline each day using a directed edge to represent each flight, going from the vertex representing the departure airport to the vertex representing the destination airport. The resulting graph will generally be a directed multigraph, as there may be multiple flights from one airport to some other airport during the same day.
EXAMPLE 10 Road Networks Graphs can be used to model road networks. In such models, vertices represent intersections and edges represent roads. When all roads are two-way and there is at most one road connecting two intersections, we can use a simple undirected graph to model the road network. However, we will often want to model road networks when some roads are one-way and when there may be more than one road between two intersections. To build such models, we use undirected edges to represent two-way roads and we use directed edges to represent
one-way roads. Multiple undirected edges represent multiple two-way roads connecting the same two intersections. Multiple directed edges represent multiple one-way roads that start at one intersection and end at a second intersection. Loops represent loop roads. Mixed graphs are needed to model road networks that include both one-way and two-way roads.
