SKEDSOFT
Introduction:
Control planning could conceivably involve many of the methods presented previously: check sheets gauge R&R to evaluate measurement systems statistical process control (SPC) charting and failure mode & effects analysis (FMEA).
Control Planning:
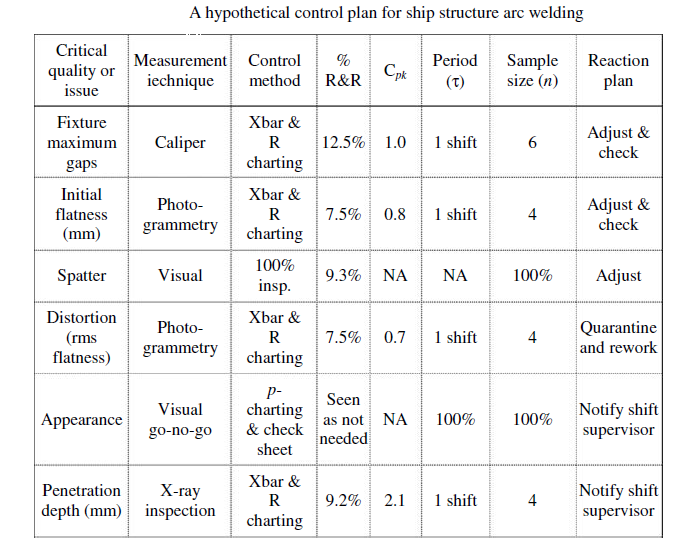
- The phrase “critical characteristics” refers to key output variables (KOVs) that are deemed important enough to system output quality that statistical process control charting should be used to monitor them. Because significant cost can be associated with a proper, active implementation of control charting, some care is generally given before declaring characteristics to be critical.
- An FMEA application can aid in determining which characteristics are associated with the highest risks and therefore might be declared critical and require intense monitoring and inspection efforts. With respect to Step 6, a subjective evaluation of each chart is made as to whether it has the desired sensitivity and response times desired. Sensitivity relates to the proximity of the limits to each other; this determines how large the effects of assignable causes need to be for detection. If the limits are too wide, n should be increased. If the limits are needlessly close together, n might be reduced to save inspection costs.
- Also, if charts would likely be too slow to usefully signal assignable cause, the inspection interval, τ, should be decreased. Depending on the effects of assignable causes, it could easily take two or three periods before the chart generates an “out of- control” signal.
- For restaurant customer satisfaction issues, several weeks before alerting the local authority may be acceptable. Therefore, τ = 1 week might be acceptable. For manufacturing problems in which scrap and rework are very costly, it may be desirable to know about assignable causes within minutes of occurrence. Then, τ = 30 minutes might be acceptable.