SKEDSOFT
Design of Experiments and Regression (Preview): DOE methods all involve:
1. Carefully planning sets of input combinations to test using a random run order; then,
2. Tests are performed and output values are recorded;
3. An interpolation method such as “regression” is then used to interpolate the outputs; and
4. The resulting prediction model is then used to predict new outputs for new possible input combinations.
Many regard the random run ordering in DOE as essential for the establishing “proof” in the statistical sense. Regression is also relevant when the choice of input combinations has not been carefully planned. Then, the data is called “on-hand,” and statistical proof is not possible in the purest sense.
Classifications of DOE: DOE methods are classified into several types, which include screening using fractional factorials, response surface methods (RSM), and robust design procedures. Here, we focus on the following three types of methods:
a) Screening using fractional factorial methods begin with a long list of possibly influential factors; these methods output a list of factors (usually fewer in number) believed to affect the average response, and an approximate prediction model.
b) Response surface methods (RSM) begin with factors believed to be important. These methods generate relatively accurate prediction models compared with screening methods, and also recommended engineering input settings from optimization.
c) Robust design based on process maximization (RDPM) methods begins with the same inputs as RSM; they generate information about the control-by-noise interactions. This information can be useful for making the system outputs more desirable and consistent, even accounting for variation in uncontrollable factors.
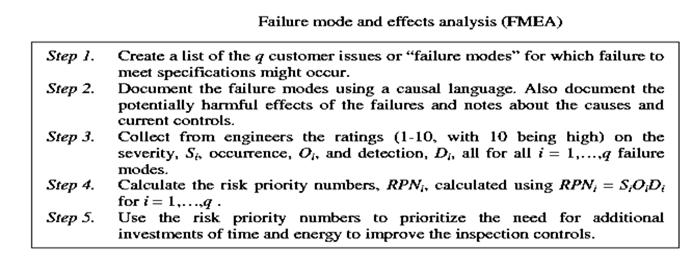
Failure Mode and Effects Analysis:
- The phrase “failure mode” refers to an inability to meet engineering specifications, expressed using a causal vocabulary. The method “Failure Mode and Effects Analysis” (FMEA), in Algorithm 5.3, uses ratings from process engineers, technicians, and/or operators to subjectively analyze the measurement system controls. Like cause and effect matrices, FMEA also results in a prioritized list of items for future study. In the case of FMEA, this prioritized list consists of the failure modes and their associated measured quality characteristics or key output variables.
- Like gauge R&R, FMEA focuses on the measurement systems. In the case of FMEA, the focus is less on the measurement system’s ability to give repeatable numbers and more on its ability to make sure nonconforming items do not reach customers. Also, FMEA can result in recommendations about system changes other than those related to measurement subsystems. Therefore, the scope of FMEA is larger than the scope of gauge R&R.
- Symbols used in the definition of FMEA:
1. q is the number of customer issues and associated specifications considered
2. Siis the severity rating for the ith issue on a 1-10 scale, with 10 meaning serious, perhaps even life-threatening.
3. Oiis the occurrence rating of the ith issue on a 1-10 scale, with 10 meaning very common or perhaps even occurring all the time.
4. Di is the detection rating based on current system operating procedures on a 1-10 scale, with 10 meaning almost no chance that the problem will be detected before the unit reaches a customer.
The following example illustrates the situation-dependent nature of FMEA analyses. It is relevant to the childcare situation of a certain home at a certain time and no others. Also, it shows how the users of FMEA do not necessarily need to be experts, although that is preferable. The FMEA in the next example simply represents the best guesses of one concerned parent, yet it was helpful to that parent in prioritizing actions.