SKEDSOFT
Measures of Dispersion
1. A variable’s dispersionis the degree to which scores on the variable differ from each other.
2. Variability and spreadaresynonyms for dispersion. There are many measures of spread.
3. The rangeis the simplest measure of dispersion. It is equal to the difference between the largest and the smallest values. The range can be a useful measure of spread because it is so easily understood. However, it is very sensitive to extreme scores since it is based on only two values.
4. The range should almost never be used as the only measure of spread but can be informative if used as a supplement to other measures of spread, such as the standard deviation and interquartile range. For example, the range is determined for the following set of numbers:
5. [10, 12, 4, 6, 13, 15, 19, 16] R = 19 − 4 = 15
6. The range is a useful statistic to know, but it cannot stand alone as a measure of spread since it takes into account only two scores.
7. Thevarianceis a measure of how spread out a distribution is. It is computed as the average squared deviation of each number from its mean. Formulas for the variance are as follows.
8. For a population:
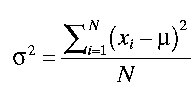
Where N is the number of population observations. For a sample j:
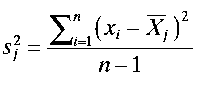
Where n is the sample size.
1. The standard deviationis the most commonly used measure of dispersion.
2. The formula for the standard deviation is the square root of the variance. An important attribute of the standard deviation is that if the mean and standard deviation of a normal distribution are known, it is possible to compute the percentile rank associated with any given observation.
3. For example, the empirical rule states that in a normal distribution, about 68.27% of the scores are within one standard deviation of the mean, about 95.45% of the scores are within two standard deviations of the mean, and about 99.73% of the scores are within three standard deviations of the mean.
4. The standard deviation is not often considered a good measure of spread in highly skewed distributions and should be supplemented in those cases by the interquartile range (IQ3 − IQ1). The interquartile range is rarely used as a measure of spread because it is not very mathematically tractable. However, it is less sensitive than the standard deviation to extreme scores, it is less subject to sampling fluctuations in highly skewed distributions, and it has a good intuitive meaning.
Inferential Statistics:
1. Inferential statisticsare used to draw inferences about a population from a sample of n observations.
2. Inferential statistics generally require that sampling be both random and representative. Observations are selected by randomly choosing the sample that resembles the population’s most important characteristics.
3. This can be obtained through the following:
1) A sample is random if the method for obtaining the sample meets the criterion of randomness (each item or element of the population having an equal chance of being chosen). Hence random numbers are typically generated from a uniform distribution U (a, b).
2) Samples are drawn independently with no sequence, correlation, or autocorrelation between consecutive observations.
3) The sample size is large enough to be representative, usually n ≥ 30.
