SKEDSOFT
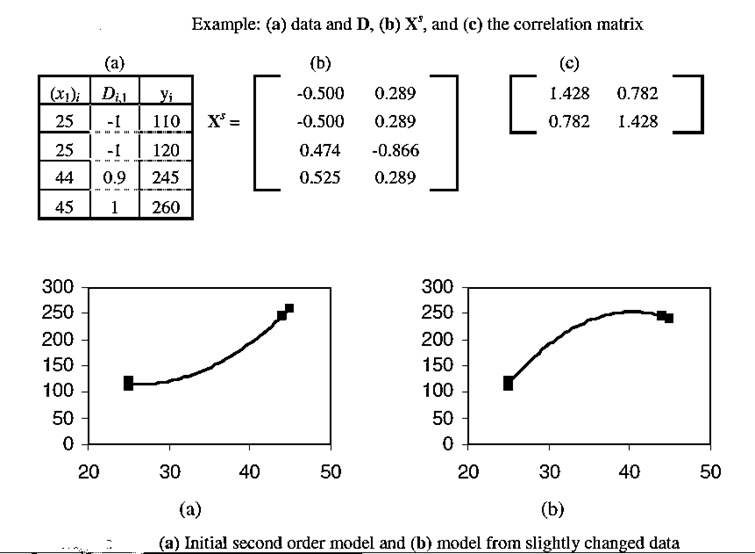
Example (Evaluating Data Quality) Does the data support fitting a quadratic model form?
Answer:Following the procedure, in Step 1, the D matrix was calculated using H1 = 45 and L1 = 25. Since there is only a single factor, D is a vector.
In Step 2, the Xs matrix was calculated using Xbar, 1 = –0.025, s1 = 1.127,
Xbar,2 = 0.953, and s2 = 0.095. In Step 3, the transpose, multiplication, and inverse operations were applied using Excel resulting in the correlation matrix. Step 4 results in the conclusion that the input data is likely not of high enough quality to support fitting a quadratic model form since r12 = 0.782 > 0.5.
Example: Interpret visually why a second order model might be unreliable when fitted to the data?
Answer:Figure (a) shows the initial fit of the second order model. Figure (b) shows the second order fit when the last observation is shifted by 20 downward.
The fact that such a small shift compared with the data range causes such a large change in appearance indicates that the input data has low quality and resulting models are unreliable.