SKEDSOFT
Summary Statistics: In addition to correlation matrices and residual plots, several numbers called “summary statistics” provide often critical information about the adequacy of the model form in question. This section describes four summary statistics: R2 adjusted, PRESS, R2 Prediction, and σest. Probably the most widely used summary statistic is the “R2 adjusted” that is
also written “adjusted R-squared” or R2 adj. This quantity is also sometimes called the “adjusted coefficient of multiple determinations”. To calculate the adjusted Rsquared, it is convenient to use an n × n matrix, Q, with every entry equaling 1.0. This permits calculation of the “sum of squares total” (SST) using
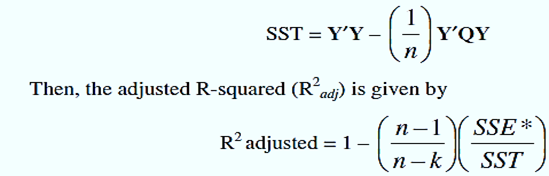
where k is the number of terms in the fitted model and SSE* is the sum of squares error .It is common to interpret R2 adj as the “fraction of the variation in the response data explained by the model”.
Example( R2 Adjusted Calculations) Calculate and interpret R2 adjusted?
Answer: The following derive from previous results and definitions:
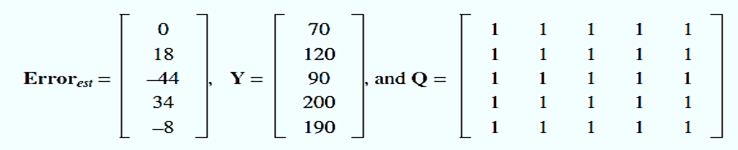
Therefore, with n = 5 data points, SST = 13720 and R2 adjusted = 0.662 so that roughly 66% of the observed variation is explained by the first order model in x1.
The phrase “cross-validation” refers to efforts to evaluate prediction errors by using some of the data points only for this purpose, i.e., a set of data points only for testing.
