SKEDSOFT
Introduction: The central limit theorem (CLT) plays an important role in statistical quality control largely because it helps to predict the performance of control charts.
The central limit theorem: In the context of SQC, the central limit theorem (CLT) can be viewed as an important fact that increases the generality of certain kinds of control charts. Also, it can be helpful for calculating the small adjustment factors d2, D1, and D2 that are commonly used in Xbar charting.
Here, the CLT is presented with no proof using the following symbols:
- X1, X2… Xn are random variables assumed to be independent identically distributed (IID). These could be quality characteristic values outputted from a process with only common causes operating. They could also be a series of outputs from some type of numerical simulation.
- f(x) is the common density function of the identically distributed X1, X2, …, Xn. Xbarn is the sample average of X1, X2, …, Xn. Xbarn is effectively the same as Xbar from Xbar charts with the “n” added to call attention to the sample size. σ is the standard deviation of the X1, X2, …, Xn, which do not need to be normally distributed.
- The CLT focuses on the properties of the sample averages, Xbarn. If X1, X2, …, Xn are independent, identically distributed (IID) random variables from a distribution function with any density function f(x) with finite mean and standard deviation, then the following can be said about the average, Xbarn, of the random variables. Defining
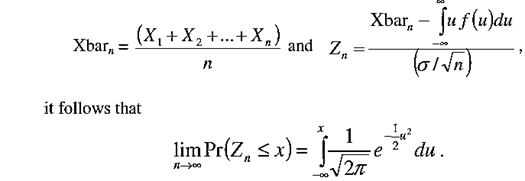
In words, averages of n random variables, Xbarn, are approximately characterized by a normal probability density function. The approximation improves as the number of quantities in the average increases.
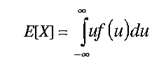
Then, the CLT implies that the sample average converges, Xbarn, converges to the true mean E[X] as the number of random variables averaged goes to infinity. Therefore, the CLT can be effectively rewritten as
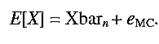
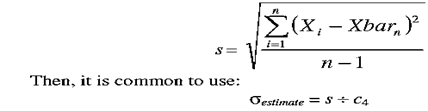
where eMC is normally distributed with mean 0.000 and standard deviation σ ÷ sqrt[n] for “large enough” n. We call Xbarn the “Monte Carlo estimate” of the mean, E[X]. There, with only common causes operating, the Xbar chart user is charting Monte Carlo estimates of the mean. Since σ is often not known, it is sometimes of interest to use the sample standard deviation, s: