SKEDSOFT
Introduction:
The Pareto diagram is a graphic depiction showing both the relative distribution as well as the absolute distribution of types of errors, problems or causes of errors. The Pareto diagram indicates the type of error (problem) to be reduced first to improve the production process.
Need for the Pareto analysis:
- It is generally known that in most cases a few types of errors (problems or causes) account for 80–90% of the total number of errors in the products and it is therefore important to identify these few major types of errors.
- This is what the Pareto diagram is used for.
Example:
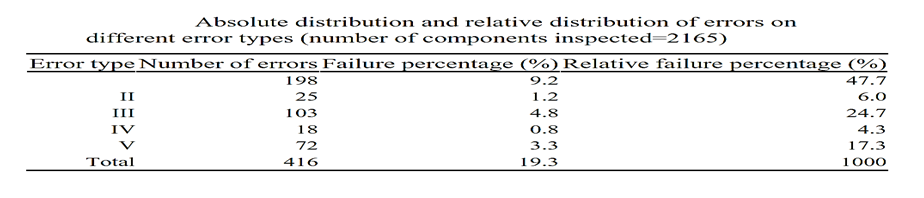
The table shows that the process functions with a failure rate of about 19% and that almost half of the errors stem from error type 1, whereas error types 1 and 3 accounts for about 72% of all errors. The Pareto diagram is constructed on the basis of Table, ranking the error types according to their failure percentage, thus giving a better overview of the same distributions.
It should be noted that the relative failure percentage expresses the failure percentage in proportion to the total failure percentage.
Pareto diagram:
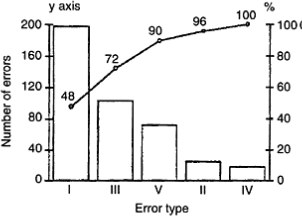
- Pareto diagram consists of a bar chart showing relative terms (right axis).
- Furthermore, the Pareto diagram consists of a broken curve showing the accumulated number of errors and the accumulated relative failure proportion.
- The Pareto diagram indicates the type of error (problem) to be reduced first to improve the production process.
Judgment:
1. Reduce error type I first, then error type III etc.
2. If this procedure is to be economically optimal, the greatest reduction in quality costs is obtained by first concentrating on error type I, then error type III etc.
3. The Pareto diagram is often used as the first step of a quality improvement programme.
4. A precondition for using the Pareto diagram in the first steps of a quality improvement programme is of course that data has been collected, i.e. the PDCA cycle has rotated at least once.
5. Otherwise more soft data must be used to identify ‘the vital few’ causes.
When quality improvement programmes are initiated, it is important that:
1. All those involved co-operate;
2. A concrete goal is chosen (the problem);
3. The programme has a great effect.
