SKEDSOFT
Error in the First-order factors in Bode diagrams
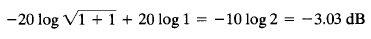
The error in the magnitude curve caused by the use of asymptotes can be calculated. The maximum error occurs at the corner frequency and is approximately equal to - 3 dB since
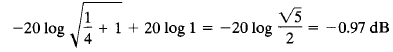
The error at the frequency one octave below the corner frequency, that is, at w = 1/(2T), is
The error at the frequency one octave above the corner frequency, that is, at ω = 2/T, is
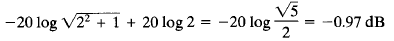
Thus, the error at one octave below or above the corner frequency is approximately equal to -1 dB. Similarly, the error at one decade below or above the corner frequency is approximately -0.04 dB.
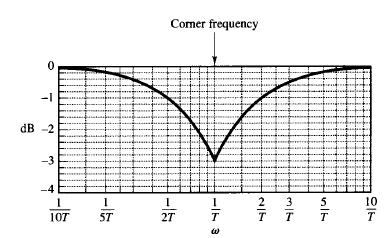
Fig: 2 Log-magnitude error in the asymptotic expression of the frequency-response curve
The error in decibels involved in using the asymptotic expression for the frequency-response curve of 1/(1 jωT) is shown in Figure 2. The error is symmetric with respect to the corner frequency. Since the asymptotes are quite easy to draw and are sufficiently close to the exact curve, the use of such approximations in drawing Bode diagrams is convenient in establishing the general nature of the frequency-response characteristics quickly with a minimum amount of calculation and may be used for most preliminary design work.
If accurate frequency-response curves are desired, corrections may easily be made by referring to the curve given in Figure 2. In practice, an accurate frequency-response curve can be drawn by introducing a correction of 3 dB at the corner frequency and a correction of 1 dB at points one octave below and above the corner frequency and then connecting these points by a smooth curve.
Note that varying the time constant T shifts the corner frequency to the left or to the right, but the shapes of the log-magnitude and the phase-angle curves remain the same.
