SKEDSOFT
Introduction to Frequency-Response Analysis
The frequency response of a system is defined as the steady-state response of the system to a sinusoidal input signal. The sinusoid is a unique input signal, and the resulting output signal for a linear system, as well as signals throughout the system, is sinusoidal in the steady state; it differs from the input waveform only in amplitude and phase angle.
For example, consider the system Y(s) = T(s)R(s) with r(t) = A sin ωt. We have
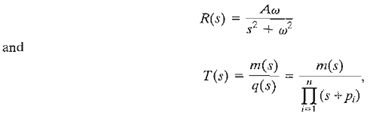
where - pi are assumed to be distinct poles. Then, in partial fraction form, we have
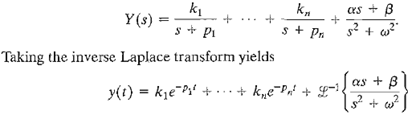
where α and β are constants which are problem dependent. If the system is stable, then all pi have positive real parts and
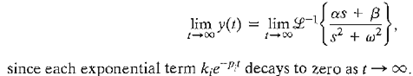
In the limit for y(t), it can be shown, for t →∞ (the steady state),
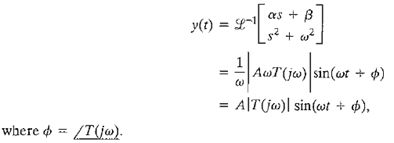
Thus, the steady-state output signal depends only on the magnitude and phase of T(jω) at a specific frequency ω. Notice that the steady-state response, is true only for stable systems, T(s).
One advantage of the frequency response method is the ready availability of sinusoid test signals for various ranges of frequencies and amplitudes. Thus, the experimental determination of the system's frequency response is easily accomplished; it is the most reliable and uncomplicated method for the experimental analysis of a system. Often, the unknown transfer function of a system can be deduced from the experimentally determined frequency response of a system. Furthermore, the design of a system in the frequency domain provides the designer with control of the bandwidth of a system, as well as some measure of the response of the system to undesired noise and disturbances.
A second advantage of the frequency response method is that the transfer function describing the sinusoidal steady-state behavior of a system can be obtained by replacing s with jω in the system transfer function T(s).The transfer function representing the sinusoidal steady-state behavior of a system is then a function of the complex variable jω and is itself a complex function T(jω) that possesses a magnitude and phase angle. The magnitude and phase angle of T(jω) are readily represented by graphical plots that provide significant insight into the analysis and design of control systems.
