SKEDSOFT
Log-magnitude versus phase plots
Another approach to graphically portraying the frequency-response characteristics is to use the log-magnitude versus phase plot, which is a plot of the logarithmic magnitude in decibels versus the phase angle or phase margin for a frequency range of interest.
[The phase margin is the difference between the actual phase angle Φ and -180°; that is, Φ - (-180°) = 180° Φ.]
The curve is graduated in terms of the frequency ω. Such log-magnitude versus phase plots are commonly called Nichols plots.
In the Bode diagram, the frequency-response characteristics of G(jω) are shown on semilog paper by two separate curves, the log-magnitude curve and the phase-angle curve, while in the log-magnitude versus phase plot, the two curves in the Bode diagram are combined into one. The log-magnitude versus phase plot can easily be constructed by reading values of the log magnitude and phase angle from the Bode diagram. Notice that in the log-magnitude versus phase plot a change in the gain constant of G(jω) merely shifts the curve up (for increasing gain) or down (for decreasing gain), but the shape of the curve remains the same.
Advantages of the log-magnitude versus phase plot are that the relative stability of the closed-loop system can be determined quickly and that compensation can be worked out easily.
The log-magnitude versus phase plots for the sinusoidal transfer function G(jω) and 1/G(jω) are skew symmetrical about the origin since
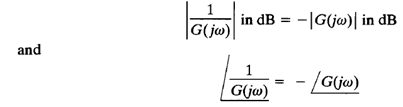
Figure 1 compares frequency-response curve of
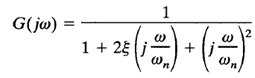 in three different representations.
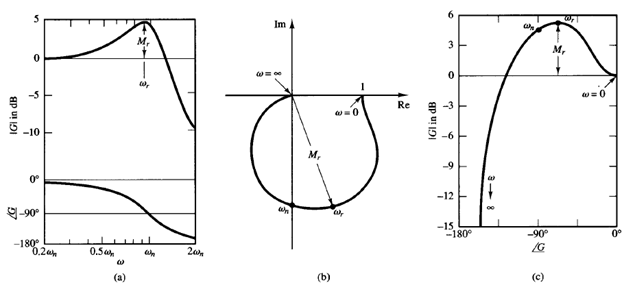
Fig 1: Three representations of the frequency response of
(a) Bode diagram; (b) polar plot; (c) log-magnitude versus phase plot.
In the log-magnitude versus phase plot, the vertical distance between the points ω = 0 and ω = ωr, where ωr is the resonant frequency, is the peak value of G(jω) in decibels
