SKEDSOFT
uadratic factors of polar plots
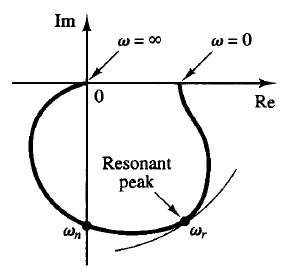
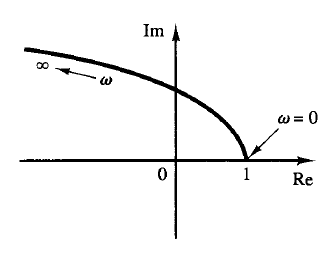
Fig: 2 Fig: 3
For the underdamped case at ω = ωn, we have G(jωn) = 1/(j2 ), and the phase angle at ω = ωn is -90°. Therefore, it can be seen that the frequency at which the G(jω) locus intersects the imaginary axis is the undamped natural frequency ωn.
In the polar plot, the frequency point whose distance from the origin is maximum corresponds to the resonant frequency ωr. The peak value of G(jω) is obtained as the ratio of the magnitude of the vector at the resonant frequency w, to the magnitude of the vector at ω = 0. The resonant frequency ω, is indicated in the polar plot shown in Figure 2.
For the overdamped case, as increases well beyond unity, the G(jω) locus approaches a semicircle. This may be seen from the fact that for a heavily damped system the characteristic roots are real and one is much smaller than the other. Since for sufficiently large the effect of the larger root (larger in the absolute value) on the response becomes very small, the system behaves like a first-order one.
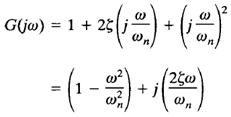
Next, consider the following sinusoidal transfer function:
The low-frequency portion of the curve is
and the high frequency portion is
Since the imaginary part of G(jω) is positive for ω > 0 and is monotonically increasing and the real part of G(jω) is monotonically decreasing from unity, the general shape of the polar plot of G(jω) is as shown in Figure 3. The phase angle is between 0° and 180°.
