SKEDSOFT
Signal-flow graph models
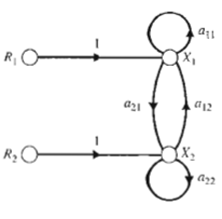
Fig: 5
The two input variables are r1 and r2, and the output variables are x1 and x2. A signal-flow graph representing the above equations is shown in Figure 5. The above equations may be rewritten as
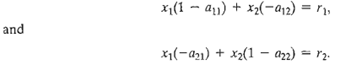
The simultaneous solution of the above equations using Cramer's rule results in the solutions