SKEDSOFT
Introduction: The most well-known and commonly used partitioning methods are k-means, k-medoids, and their variations.
Centroid-Based Technique: The k-Means Method: The k-means algorithm takes the input parameter, k, and partitions a set of n objects into k clusters so that the resulting intra cluster similarity is high but the inter cluster similarity is low. Cluster similarity is measured in regard to the mean value of the objects in a cluster, which can be viewed as the cluster’s centroid or center of gravity.
The k-means algorithm proceeds as follows. First, it randomly selects k of the objects, each of which initially represents a cluster mean or center. For each of the remaining objects, an object is assigned to the cluster to which it is the most similar, based on the distance between the object and the cluster mean. It then computes the new mean for each cluster. This process iterates until the criterion function converges. Typically, the square-error criterion is used, defined as
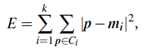
where E is the sum of the square error for all objects in the data set; p is the point in space representing a given object; and mi is the mean of cluster Ci (both p and mi are multidimensional). In other words, for each object in each cluster, the distance from the object to its cluster center is squared, and the distances are summed. This criterion tries to make the resulting k clusters as compact and as separate as possible.
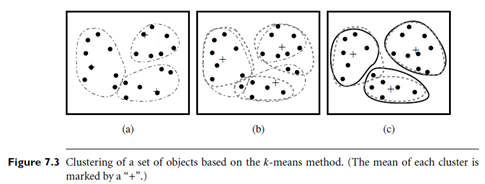
Example: Clustering by k-means partitioning. Suppose that there is a set of objects located in space as depicted in the rectangle shown in Figure 7.3(a). Let k = 3; that is, the user would like the objects to be partitioned into three clusters.
According to the algorithm in Figure 7.2, we arbitrarily choose three objects as the three initial cluster centers, where cluster centers are marked by a “ ”. Each object is distributed to a cluster based on the cluster center to which it is the nearest. Such a distribution forms silhouettes encircled by dotted curves, as shown in Figure 7.3(a).
Next, the cluster centers are updated. That is, the mean value of each cluster is recalculated based on the current objects in the cluster. Using the new cluster centers, the objects are redistributed to the clusters based on which cluster center is the nearest. Such redistribution forms new silhouettes encircled by dashed curves, as shown in Figure 7.3(b).
This process iterates, leading to Figure 7.3(c). The process of iteratively reassigning objects to clusters to improve the partitioning is referred to as iterative relocation. Eventually, no redistribution of the objects in any cluster occurs, and so the process terminates. The resulting clusters are returned by the clustering process.
The algorithm attempts to determine k partitions that minimize the square-error function. It works well when the clusters are compact clouds that are rather well
Algorithm: k-means. The k-means algorithm for partitioning, where each cluster’s center is represented by the mean value of the objects in the cluster.
Input:
k: the number of clusters,
D: a data set containing n objects.
Output: A set of k clusters.
Method:
(1) arbitrarily choose k objects from D as the initial cluster centers;
(2) repeat
(3) (re)assign each object to the cluster to which the object is the most similar, based on the mean value of the objects in the cluster;
(4) update the cluster means, i.e., calculate the mean value of the objects for
each cluster;
(5) until no change;
separated from one another. The method is relatively scalable and efficient in processing large data sets because the computational complexity of the algorithm is O(nkt), where n is the total number of objects, k is the number of clusters, and t is the number of iterations. Normally, k< n and t <n. The method often terminates at a local optimum.
