SKEDSOFT
Introduction: A bank loans officer needs analysis of her data in order to learn which loan applicants are “safe” and which are “risky” for the bank. A marketing manager at All Electronics needs data analysis to help guess whether a customer with a given profile will buy a new computer.
A medical researcher wants to analyze breast cancer data in order to predict which one of three specific treatments a patient should receive. In each of these examples, the data analysis task is classification, where a model or classifier is constructed to predict categorical labels, such as “safe” or “risky” for the loan application data; “yes” or “no” for the marketing data; or “treatment A,” “treatment B,” or “treatment C” for the medical data. These categories can be represented by discrete values, where the ordering among values has no meaning. For example, the values 1, 2, and 3 may be used to represent treatments A, B, and C, where there is no ordering implied among this group of treatment regimes.
Suppose that the marketing manager would like to predict how much a given customer will spend during a sale at All Electronics. This data analysis task is an example of numeric prediction, where the model constructed predicts a continuous-valued function, or ordered value, as opposed to a categorical label. This model is a predictor. Regression analysis is a statistical methodology that is most often used for numeric prediction, hence the two terms are often used synonymously. We do not treat the two terms as synonyms, however, because several other methods can be used for numeric prediction, as we shall see later in this chapter. Classification and numeric prediction are the two major types of prediction problems. For simplicity, when there is no ambiguity, we will use the shortened term of prediction to refer to numeric prediction.
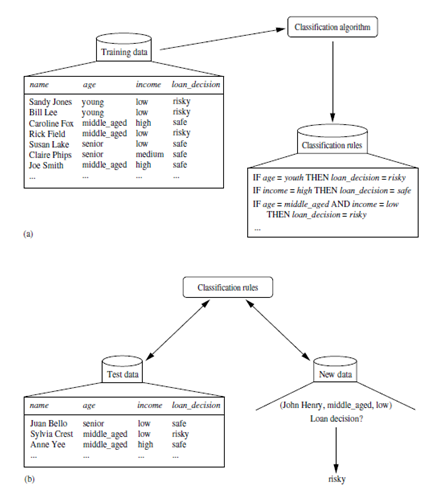 “How does classification work? Data classification is a two-step process, as shown for the loan application data of Figure 6.1. (The data are simplified for illustrative purposes. In reality, we may expect many more attributes to be considered.) In the first step, a classifier is built describing a predetermined set of data classes or concepts. This is the learning step (or training phase), where a classification algorithm builds the classifier by analyzing or “learning from” a training set made up of database tuples and their associated class labels. A tuple, X, is represented by an n-dimensional attribute vector, X = (x1, x2, : : : , xn), depicting n measurements made on the tuple from n database attributes, respectively, A1, A2, : : : , An.1 Each tuple, X, is assumed to belong to a predefined class as determined by another database attribute called the class label attribute.
The class label attribute is discrete-valued and unordered. It is categorical in that each value serves as a category or class. The individual tuples making up the training set are referred to as training tuples and are selected from the database under analysis. In the context of classification, data tuples can be referred to as samples, examples, instances, data points, or objects.2 Because the class label of each training tuple is provided, this step is also known as supervised learning (i.e., the learning of the classifier is “supervised” in that it is told to which class each training tuple belongs). It contrasts with unsupervised learning (or clustering), in which the class label of each training tuple is not known, and the number or set of classes to be learned may not be known in advance. For example, if we did not have the loan decision data available for the training set, we could use clustering to try to determine “groups of like tuples,” which may correspond to risk groups within the loan application data
