SKEDSOFT
Multiresolution Methods: A common way to deal with a large amount of data is through the use of data reductionmethods . A popular data reduction method is the use of divide-and conquersstrategies such as multiresolution data structures. These allow a program totrade off between accuracy and storage, but also offer the ability to understand a datastream at multiple levels of detail.
- A concrete example is a balanced binary tree, where we try to maintain this balance as new data come in. Each level of the tree provides a different resolution. The farther away we are from the tree root, the more detailed is the level of resolution.
- A more sophisticated way to form multiple resolutions is to use a clustering method to organize stream data into a hierarchical structure of trees. For example, we can use a typical hierarchical clustering data structure like CF-tree in BIRCH to forma hierarchy of micro clusters. With dynamic stream data flowing in and out, summary statistics of data streams can be incrementally updated over time in the hierarchy of microclusters. Information in such microclusters can be aggregated into larger macroclusters depending on the application requirements to derive general data statistics at multiresolution.
- Wavelets, a technique from signal processing, can be used to build a multiresolution hierarchy structure over an input signal, in this case, the stream data. Given an input signal, we would like to break it down or rewrite it in terms of simple, orthogonal basis functions. The simplest basis is the Haar wavelet. Using this basis corresponds to recursively performing averaging and differencing at multiple levels of resolution. Haar wavelets are easy to understand and implement. They are especially good at dealing with spatial and multimedia data. Wavelets have been used as approximations to histograms for query optimization. Moreover, wavelet-based histograms can be dynamically maintained over time. Thus, wavelets are a popular multiresolution method for data stream compression.
Sketches: Synopses techniques mainly differ by how exactly they trade off accuracy for storage. Sampling techniques and sliding window models focus on a small part of the data, whereas other synopses try to summarize the entire data, often at multiple levels of detail. Some techniques require multiple passes over the data, such as histograms and wavelets, whereas other methods, such as sketches, can operate in a single pass.
Suppose that, ideally, we would like to maintain the full histogram over the universe of objects or elements in a data stream, where the universe is U = {1, 2, : : : , v} and the stream is A = {a1, a2, : : : , aN}. That is, for each value i in the universe, we want to maintain the frequency or number of occurrences of i in the sequence A. If the universe is large, this structure can be quite large as well. Thus, we need a smaller representation instead.
Let’s consider the frequency moments of A. These are the numbers, Fk, defined as
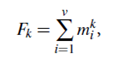
Where v is the universe or domain size (as above), mi is the frequency of i in the sequence, and k ≥ 0. In particular, F0 is the number of distinct elements in the sequence. F1 is the length of the sequence (that is, N, here). F2 is known as the self-join size, the repeat rate, or as Gini’s index of homogeneity. The frequency moments of a data set provide useful information about the data for database applications, such as query answering. In addition, they indicate the degree of skew or asymmetry in the data, which is useful in parallel database applications for determining an appropriate partitioning algorithm for the data.
From a database perspective, sketch partitioning was developed to improve the performance of sketching on data stream query optimization. Sketch partitioning uses coarse statistical information on the base data to intelligently partition the domain of the underlying attributes in a way that provably tightens the error guarantees.
