SKEDSOFT
Introduction: Model-based clustering methods attempt to optimize the fit between the given data and some mathematical model. Such methods are often based on the assumption that the data are generated by a mixture of underlying probability distributions. In this section, we describe three examples of model-based clustering.
1. Expectation-Maximization
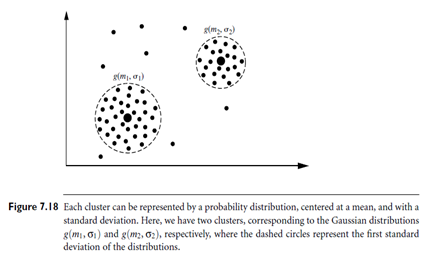
In practice, each cluster can be represented mathematically by a parametric probability distribution. The entire data is a mixture of these distributions, where each individual distribution is typically referred to as a component distribution. We can therefore cluster the data using a finite mixture density model of k probability distributions, where each distribution represents a cluster. The problem is to estimate the parameters of the probability distributions so as to best fit the data. Figure 7.18 is an example of a simple finite mixture density model. There are two clusters. Each follows a normal or Gaussian distribution with its own mean and standard deviation.
The EM (Expectation-Maximization) algorithm is a popular iterative refinement algorithm that can be used for finding the parameter estimates. It can be viewed as an extension of the k-means paradigm, which assigns an object to the cluster with which it is most similar, based on the cluster mean (Section 7.4.1). Instead of assigning each object to a dedicated cluster, EM assigns each object to a cluster according to a weight representing the probability of membership. In other words, there are no strict boundaries between clusters. Therefore, new means are computed based on weighted measures. EM starts with an initial estimate or “guess” of the parameters of the mixture model (collectively referred to as the parameter vector). It iteratively rescores the objects against the mixture density produced by the parameter vector. The rescored objects are then used to update the parameter estimates. Each object is assigned a probability that it would possess a certain set of attribute values given that it was a member of a given cluster. The algorithm is described as follows:
1. Make an initial guess of the parameter vector: This involves randomly selecting k objects to represent the cluster means or centers (as in k-means partitioning), as well as making guesses for the additional parameters.
2. Iteratively refine the parameters (or clusters) based on the following two steps:
a. Expectation Step: Assign each object xi to cluster Ck with the probability
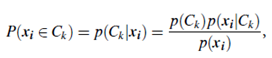
where p(xi|Ck) = N(mk, Ek(xi)) follows the normal (i.e., Gaussian) distribution around mean, mk, with expectation, Ek. In other words, this step calculates the probability of cluster membership of object xi, for each of the clusters. These probabilities are the “expected” cluster memberships for object xi.
b. Maximization Step: Use the probability estimates from above to re-estimate (or refine) the model parameters. For example,
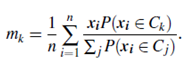
This step is the “maximization” of the likelihood of the distributions given the data.
The EM algorithm is simple and easy to implement. In practice, it converges fast but may not reach the global optima. Convergence is guaranteed for certain forms of optimization functions. The computational complexity is linear in d (the number of input features), n (the number of objects), and t (the number of iterations).
Bayesian clustering methods focus on the computation of class-conditional probability density. They are commonly used in the statistics community. In industry, Auto Class is a popular Bayesian clustering method that uses a variant of the EM algorithm. The best clustering maximizes the ability to predict the attributes of an object given the correct cluster of the object. Auto Class can also estimate the number of clusters. It has been applied to several domains and was able to discover a new class of stars based on infrared astronomy data. Further references are provided in the bibliographic notes.
