SKEDSOFT
Introduction: The trail-based approach to similarity search was pioneering, yet has a number of limitations. In particular, it uses the Euclidean distance as a similarity measure, which is sensitive to outliers. Furthermore, what if there are differences in the baseline and scale of the two time series being compared? What if there are gaps? Here, we discuss an approach that addresses these issues.
For similarity analysis of time-series data, Euclidean distance is typically used as a similarity measure. Here, the smaller the distance between two sets of time-series data, the more similar are the two series. However, we cannot directly apply the Euclidean distance. Instead, we need to consider differences in the baseline and scale (or amplitude) of our two series. For example, one stock’s value may have a baseline of around $20 and fluctuate with a relatively large amplitude (such as between $15 and $25), while another could have a baseline of around $100 and fluctuate with a relatively small amplitude (such as between $90 and $110). The distance from one baseline to another is referred to as the offset.
A straight forward approach to solving the baseline and scale problem is to apply a normalization transformation. For example, a sequence X ={x1, x2, : : : , xn} can be replaced by a normalized sequence X’ = {x’1 , x’2 , : : : , x’n}, using the following formula,
X’i = xi-μ /σ
where μ is the mean value of the sequence X and σ is the standard deviation of X. We can transform other sequences using the same formula, and then compare them for similarity.
Most real-world applications do not require the matching subsequences to be perfectly aligned along the time axis. In other words, we should allow for pairs of subsequences to match if they are of the same shape, but differ due to the presence of gaps within a sequence (where one of the series may be missing some of the values that exist in the other) or differences in offsets or amplitudes. This is particularly useful in many similar sequence analyses, such as stock market analysis and cardiogram analysis.
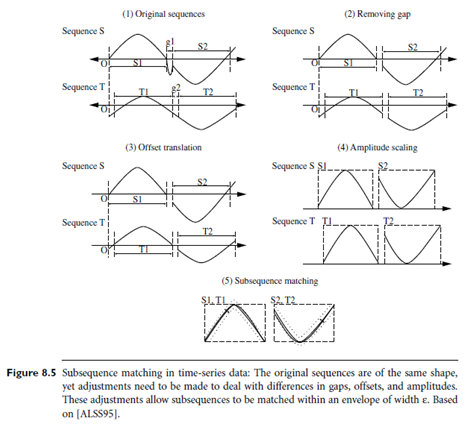 Users or experts can specify parameters such as a sliding window size, the width of an envelope for similarity, the maximum gap, a matching fraction, and so on. Figure 8.5 illustrates the process involved, starting with two sequences in their original form. First, gaps are removed. The resulting sequences are normalized with respect to offset translation (where one time series is adjusted to align with the other by shifting the baseline or phase) and amplitude scaling. For this normalization, techniques such as those described in Section 2.4.2 may be used. Two subsequences are considered similar and can be matched if one lies within an envelope of e width around the other (where e is a small number, specified by a user or expert), ignoring outliers.
Two sequences are similar if they have enough non overlapping time-ordered pairs of similar subsequences.
Based on the above, a similarity search that handles gaps and differences in offsets and amplitudes can be performed by the following steps:
- Atomic matching: Normalize the data. Find all pairs of gap-free windows of a small length that are similar.
- Window stitching: Stitch similar windows to form pairs of large similar subsequences, allowing gaps between atomic matches.
- Subsequence ordering: Linearly order the subsequence matches to determine whether enough similar pieces exist.
With such processing, sequences of similar shape but with gaps or differences in offsets or amplitudes can be found to match each other or to match query templates.
