SKEDSOFT
EWMA Charting for Continuous Data (cont.):
Algorithm used in the EWMA charting for continuous data.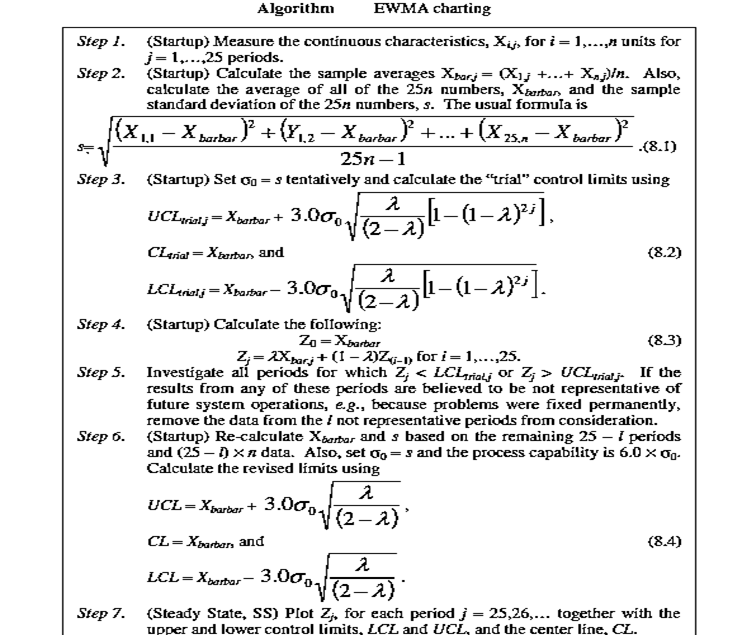
Multivariate Charting Concepts:
I. Often, one person or team may have monitoring responsibilities for a large number of continuous characteristics. For example, in chemical plants a team can easily be studying thousands of characteristics simultaneously. Monitoring a large number of charts likely generates at least two problems.
II. False alarms may overburden personnel and/or demoralize chart users. If a single chart has a false alarm roughly once every 370 periods, one thousand charts could generate many false alarms each period. With high rates of false alarms, the people in charge of monitoring could easily abandon the charts and turn to anecdotal information.
III. Maintenance of a large number of charts could by itself constitute a substantial, unnecessary administrative burden. This follows because usually a small number of causes could be affecting a large number of characteristics. Logically, it could be possible to have a small number of charts, one for each potential cause.
IV. A fairly simple set of assembly operations on two production lines. A single process engineer could easily be in charge of monitoring all 14 quality characteristics involved. Also, misplacement of second cylinder on the first could easily affect all quality characteristics on a given production line.
