SKEDSOFT
Attribute Data: p-Charting (Restaurant Customer Satisfaction cont.):
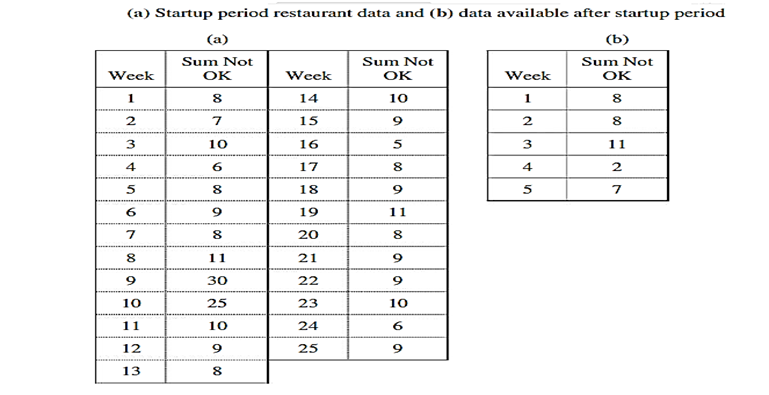
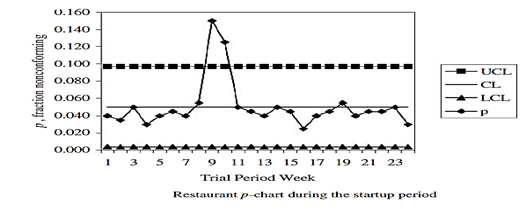
The revised limits are:
p0= (total number nonconforming) ÷ (total number inspected) = 197/4600 = 0.043,
UCL = 0.043 3.0 × sqrt [(0.043) × (1 – 0.043) ÷ 200] = 0.086,
CL = 0.043, and
LCL = Max {0.043 – 3.0 × sqrt [(0.043) × (1 – 0.043) ÷ 200], 0.0} = 0.000.
Example (Arc Welding Rework Charting):
A process engineer decides to study the fraction of welds going into a rework operation using p-charting. Suppose that 2500 welds are inspected over 25 days and 120 are found to require rework. Suppose one day had 42 nonconforming welds which were caused by a known corrected problem and another subgroup had 12 nonconformities but no assignable cause could be found. What are your revised limits and what is the process capability?
Answer: Assuming a constant sample size with 25 subgroups gives n = 100.
The trial limits are p0 = 120/2500 = 0.048,
UCLtrial = 0.110, CLtrial = 0.048,
and LCLtrial = 0.000, so there is effectively no lower control limit. We remove only the subgroup whose values are believed to be not representative of the future.
The revised numbers are p0 = 78/2400 = 0.0325, UCL = 0.0857, CL = the process capability = 0.0325, and LCL = 0.000.
