SKEDSOFT
The Cpk, Ppk Quandary:
- In 1991, ASQ / AIAG task force published the "Statistical Process Control" reference manual, which presented the calculations for capability indices ( Cp, Cpk ) as well as process performance indices( Pp, Ppk ).
- The difference between the two indices is the way the process standard deviation (s) is calculated.
- Cpk uses s which is estimated using ( R-Bar / d2 ) or ( S-Bar / C2 ) .
- Ppk uses the calculated standard deviation from individual data where s is calculated by the formula :
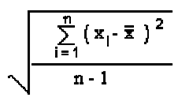
Note:
1.As a thumb rule a minimum of 50 randomly selected samples must be chosen for process performance studies and a minimum of 20 subgroups (of sample size, preferably of at least4 or 5) must be chosen for process capability studies.
2.Cpk for all critical product measurements considered important by the customer should be calculated at the beginning of initial production to determine the general ability of the process to meet customer specifications. Then from time to time, over the life of the product, Cpk must be generated. A control chart must always be maintained to check statistical stability of the process before capability is computed.
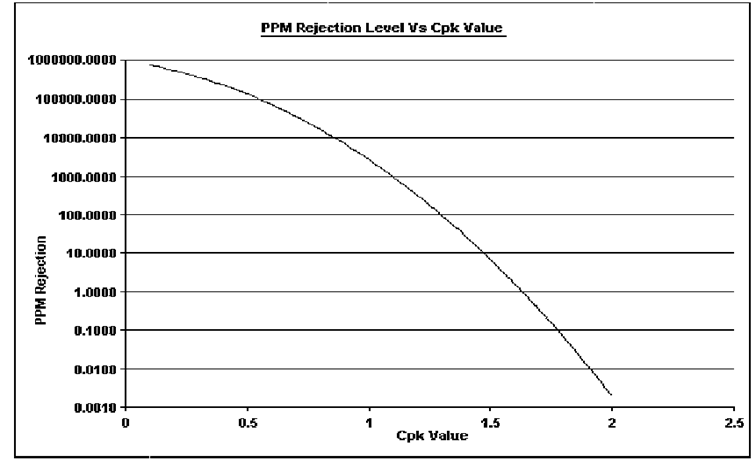
Process Capability and Defect Rate:
Using process capability indices it is easy to forget how much of product is falling beyond specification. The conversion curve presented here can be a useful tool for interpreting Cpk with
its corresponding defect levels. The defect levels or parts per million non-conforming we recomputed for different Cpk values using the Z scores and the percentage area under the standard normal curve using normal deviate tables.
The table below presents the non-conforming parts per million (ppm) for a process corresponding to Cpk values if the process mean were at target.