SKEDSOFT
Introduction:
The traditional method is to record costs as they arise (e.g. wage costs, material etc.) or are thought to arise (e.g. depreciations). However, this method is only applicable in calculating visible costs. The method builds on the basic principle of benchmarking where differences in quality and productivity may be revealed by comparing firms competing in the same market.
Method: The method is as follows.
Let Pjt stand for the ordinary financial result of company j at time t, and let Pjt/Nj stand for the ordinary financial result per employee. Nj denotes the number of employees, converted to full-time employees, in company j. Assume also that there are m comparable firms competing in the same industry/market. Now let the m competing firms be ranked as follows:
P1t/N1<P2t/N2<…<Pmt/Nm
Based on this ranking, the lower limit of company j’s total quality costs at time t can now be calculated:
Cjt= (Pmt/Nm–Pjt/Nj) ×Nj= (Nj /Nm) ×Pmt–Pjt
Lower limit is calculated as the difference between the ordinary financial result per employee of the most profitable firm (per employee) and company j, multiplied by the number of employees in company j.
Example:
- The example is based on an analysis of the financial statements of printing firms with at least 20 employees. Initially, there were 80 such firms who were thought to be comparable with company j, a printing firm with 64 employees.
- The most profitable firm had a profit of 199 966 kroner per employee, while the most unprofitable firm had a loss of 254142 kroner per employee. 30%, i.e. 24 of the 80 firms had losses. The lower limit for total quality costs thus varies considerably between the 80 firms.
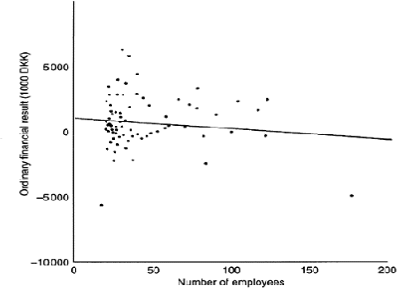
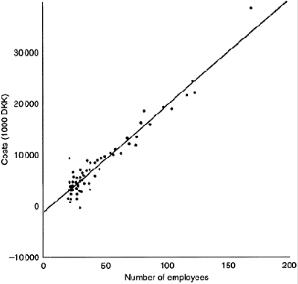
Fig: 1 Fig: 2
- The relation between the ordinary profit and number of employees among 80 firms in the Danish printing industry.
- The relation between the lower limit for quality costs and number of employees among 80 firms in the printing industry
- It can be seen from Figure 1 that, there is a big variation around the straight line which shows the relationship between quality costs and company size. The conclusion is that, although we cannot definitely prove that there is a correlation, if there is one, and then this straight line is our best estimate of it.
- The model in Figure 2 thus tells us that the biggest firms in the printing industry also have the highest quality costs. Not surprising, perhaps.
